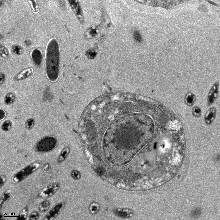
Fig 1E_S1.tif
TIFF · 2048 x 2048 x 59 · middle z 29
Scale: 3.5 x 3.5 x 70 nm · trakem2_calibration
Open Slice Viewer13 ready volumes, 1 blocked volumes, and 16 sidecars.
Validation warnings: 1. Asset states: needs_review: 1, not_applicable: 16, validated: 13.
No reviewed data reuse notes are posted for this pilot.
0.262 GiB · trakem2_z_spacing_suspicious:15nm
Inspect the paired TrakEM2 XML and paper methods for section thickness before conversion.
Jump to previewSlice caches are browser-sized PNG planes for fast inspection. They are not canonical scientific derivatives; OME-Zarr remains the production target.
| Asset | Volume | Viewer Cache | OME-Zarr | Open |
|---|---|---|---|---|
| Fig 1E_S1.tif Fig 1E_S1.tif | TIFF · 2048 x 2048 x 59 Scale: 3.5 x 3.5 x 70 nm | Full 59/59 27.8 MiB | Not yet | Open Viewer |
| Fig 1E_S2.tif Fig 1E_S2.tif | TIFF · 1024 x 1024 x 60 Scale: 7.138 x 7.138 x 70 nm | Full 60/60 28.5 MiB | Not yet | Open Viewer |
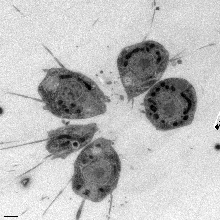
| Fig 1E_S3.tif Fig 1E_S3.tif | TIFF · 2048 x 2048 x 58 Scale: 3.4 x 3.4 x 70 nm | Full 58/58 27.2 MiB | Not yet | Open Viewer |
| Fig 1F_C1.tif Fig 1F_C1.tif | TIFF · 2048 x 2048 x 54 Scale: 2.58421 x 2.58421 x 80 nm | Full 54/54 26.3 MiB | Not yet | Open Viewer |
| Fig 1F_C2.tif Fig 1F_C2.tif | TIFF · 2048 x 2048 x 50 Scale: 2.58734 x 2.58734 x 80 nm | Full 50/50 24.8 MiB | Not yet | Open Viewer |
| Fig 1F_C3.tif Fig 1F_C3.tif | TIFF · 2048 x 2048 x 59 Scale: 2.58625 x 2.58625 x 80 nm | Full 59/59 29.3 MiB | Not yet | Open Viewer |
| Fig 3A-D_RC1.tif Fig 3A-D_RC1.tif | TIFF · 2048 x 2048 x 111 Scale: 5.5 x 5.5 x 80 nm | Sampled 96/111 43.3 MiB | Not yet | Open Viewer |
| Fig 3M_RC2.tif Fig 3M_RC2.tif | TIFF · 2048 x 2048 x 64 Scale: 5.37285 x 5.37285 x 150 nm | Full 64/64 28.2 MiB | Not yet | Open Viewer |
| Fig 3M_RC3.tif Fig 3M_RC3.tif | TIFF · 2048 x 2048 x 73 Scale: 7.29259 x 7.29259 x 150 nm | Full 73/73 30.8 MiB | Not yet | Open Viewer |
| Fig 3M_RC5.tif Fig 3M_RC5.tif | TIFF · 2048 x 2048 x 64 Scale: 7.30951 x 7.30951 x 150 nm | Full 64/64 27.7 MiB | Not yet | Open Viewer |
| Fig 4C-E_choanocyte.tif Fig 4C-E_choanocyte.tif | TIFF · 2048 x 2048 x 65 Scale: 7.29305 x 7.29305 x 150 nm | Full 65/65 29.6 MiB | Not yet | Open Viewer |
| Fig 4F_choanocyte apical pole.tif Fig 4F_choanocyte apical pole.tif | TIFF · 2048 x 2048 x 14 Scale: 1.11085 x 1.11085 x 75 nm | Full 14/14 6.9 MiB | Not yet | Open Viewer |
| Fig 4G_choanoflagellate apical pole.tif Fig 4G_choanoflagellate apical pole.tif | TIFF · 2048 x 2048 x 14 Scale: 0.94316 x 0.94316 x 70 nm | Full 14/14 7.0 MiB | Not yet | Open Viewer |
No OME-Zarr derivative has been generated for this pilot dataset yet.
Dependency-light PNG previews generated from local TIFF/MRC volumes.
TIFF · 2048 x 2048 x 59 · middle z 29
Scale: 3.5 x 3.5 x 70 nm · trakem2_calibration
Open Slice Viewer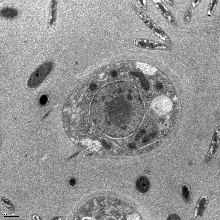
TIFF · 1024 x 1024 x 60 · middle z 30
Scale: 7.138 x 7.138 x 70 nm · trakem2_calibration
Open Slice Viewer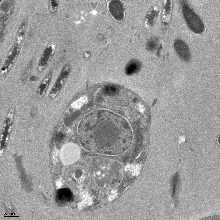
TIFF · 2048 x 2048 x 58 · middle z 29
Scale: 3.4 x 3.4 x 70 nm · trakem2_calibration
Open Slice Viewer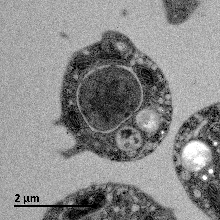
TIFF · 2048 x 2048 x 54 · middle z 27
Scale: 2.58421 x 2.58421 x 80 nm · trakem2_calibration_times_layer_thickness
Open Slice Viewer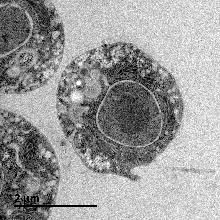
TIFF · 2048 x 2048 x 50 · middle z 25
Scale: 2.58734 x 2.58734 x 80 nm · trakem2_calibration_times_layer_thickness
Open Slice Viewer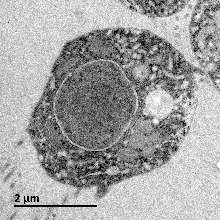
TIFF · 2048 x 2048 x 59 · middle z 29
Scale: 2.58625 x 2.58625 x 80 nm · trakem2_calibration_times_layer_thickness
Open Slice Viewer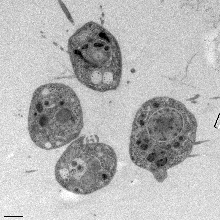
TIFF · 2048 x 2048 x 111 · middle z 55
Scale: 5.5 x 5.5 x 80 nm · trakem2_calibration
Open Slice Viewer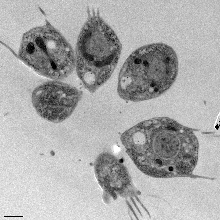
TIFF · 2048 x 2048 x 64 · middle z 32
Scale: 5.37285 x 5.37285 x 150 nm · trakem2_calibration_times_layer_thickness
Open Slice Viewer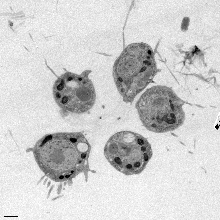
TIFF · 2048 x 2048 x 73 · middle z 36
Scale: 7.29259 x 7.29259 x 150 nm · trakem2_calibration
Open Slice Viewer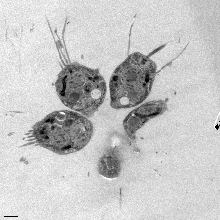
TIFF · 2048 x 2048 x 67 · middle z 33
Blocked: trakem2_z_spacing_suspicious:15nm
TIFF · 2048 x 2048 x 64 · middle z 32
Scale: 7.30951 x 7.30951 x 150 nm · trakem2_calibration
Open Slice Viewer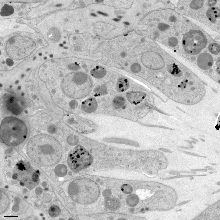
TIFF · 2048 x 2048 x 65 · middle z 32
Scale: 7.29305 x 7.29305 x 150 nm · trakem2_calibration
Open Slice Viewer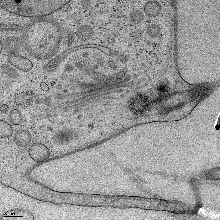
TIFF · 2048 x 2048 x 14 · middle z 7
Scale: 1.11085 x 1.11085 x 75 nm · trakem2_calibration
Open Slice Viewer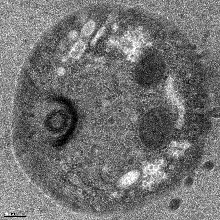
TIFF · 2048 x 2048 x 14 · middle z 7
Scale: 0.94316 x 0.94316 x 70 nm · trakem2_calibration
Open Slice Viewer